Appendix D: Log Viewer
Picard maintains a log of events that can be useful for troubleshooting and understanding the behavior of Picard. The log viewer allows you to view and filter these log entries, and to export the log to a file for sharing with others or attach to bug reports. This is also where you set the log level and select which debug options to include in the log during the current session. Note that Picard will automatically reset the log level to the default value selected in the Startup Options automatically each time Picard is started, unless the --debug command line option is specified or the PICARD_DEBUG environment variable is set.
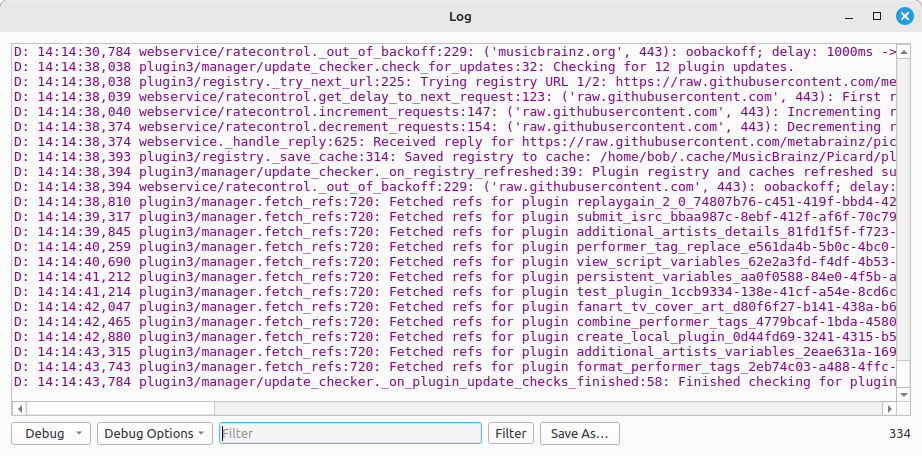
The log viewer is accessed from the menu. It displays log entries in a table with columns for the log level, log timestamp, module and method (with line number) that generated the entry, and message. The number of lines in the log is displayed in the lower right-hand corner of the window.
Log Settings
The amount of information that is logged can be controlled by setting the log level and selecting which debug options to include in the log. These can be set from within the log viewer using the controls at the bottom of the window. When set from within the log viewer, the selected log level and debug options will be applied immediately.
The log level can be overridden to Debug, and debug options can be set for a session by starting Picard using the --debug and --debug-opts command line options.
Log level
The level of logging that is enabled for the current session is selected from a dropdown control. The options are Error, Warning, Info, and Debug. Entries will be logged at the selected level or above. For example, selecting Warning will log Warning and Error entries, but not Debug or Info entries. In general, it is recommended to set the log level to Info for normal use to avoid excessive logging, and only use Debug when troubleshooting specific issues to ensure that all log entries are captured.
Note that the selected log level is applied immediately, so if you change the level to Warning, then only Warning and Error level events will be logged from that point forward. However, log entries that were captured at a lower level prior to changing the log level will not be removed from the log, and will still be visible in the log viewer until the log is cleared. The log level will be reset to the default value selected in the Startup Options automatically each time Picard is started.
The log level selector is also used to filter the log entries that are displayed in the log viewer. If you change the level to Warning, then only Warning and Error level entries will be displayed in the log viewer, even if more detailed entries are being logged at a lower level.
Debug options
The various debug options have been specifically designed to assist troubleshooting by allowing detailed logging of events that would not normally be included in the debug log. This can help developers identify issues and understand the behavior of their plugins or code changes within Picard. Debug log entries are useful when a user is trying to understand which plugin is making changes to metadata and such, but extensive debug logging such as that required for troubleshooting a specific plugin or code change can be overwhelming.
When Picard is started with one or more debug options enabled using the --debug-opts command line option, additional detail specific to the selected options may be logged in addition to the standard log entries. These should only be enabled when necessary for troubleshooting, generally at the request of a developer investigating a reported issue, because they can generate an extremely large amount of log data. By default, none of the debug options are enabled.
The Debug Options dropdown allows you to select which debug option categories to enable, in the same way as if they had been enabled via the command line. Note that additional debug log entries will only be logged if the log level is set to Debug. Also note that any additional detailed entries encountered prior to enabling the debug options will not be logged.
If you are troubleshooting an issue, it is recommended to set the log level to Debug, and only enable any applicable debug options requested by a developer investigating a reported issue, to ensure that all relevant log entries are captured without generating excessive unnecessary log data.
Filtering
When troubleshooting an issue, it can be helpful to filter the log entries to focus on relevant information. The log viewer provides controls for filtering the log entries by log level and text search.
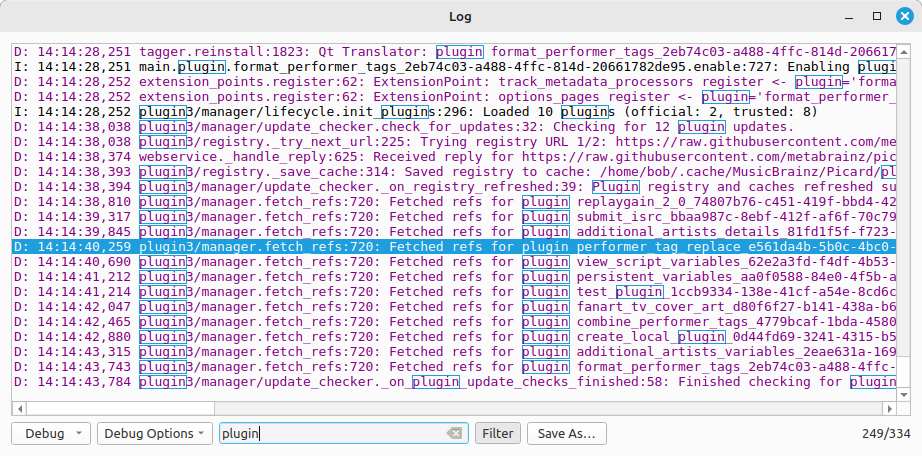
The filters can be used in combination to further narrow down the log entries. For example, you could filter to show only Warning and Error level entries that contain the text “plugin” to focus on potential plugin-related issues. When the log is filtered, the number of lines that are currently displayed and the total number of lines in the log are both shown in the lower right-hand corner of the window.
Log level
The log level dropdown control is used to select the level to filter the log entries. Selecting a log level will show only entries at that level and above. For example, selecting Warning will show Warning and Error entries, but not Debug or Info entries.
Note that changing this setting also changes the log level for the current session, so if you change the level to Warning, then only Warning and Error level events will be logged from that point forward.
Filter text
In order to limit the log entries displayed to those that contain specific text, you can enter a text string in the filter text box next to the Debug Options selector, and then click the Filter button. This will show only entries that contain the specified text. The filter is case-insensitive and matches any part of the log entry, including the log level, timestamp, module and method, and message.
If you wish to use a regular expression to filter the log entries, you must enable the Regex filter option in the log viewer context menu. The context menu is accessed by right-clicking in the log viewer window. You enter the regular expression in the text box, and then click the Filter button. This will show only entries that match the specified regular expression.
The regular expression syntax is that of Python’s re module, and the search is case-sensitive. You are not able to pass regular expression flags such as re.IGNORECASE when using the regular expression filter, but you can use inline flags in the regular expression itself such as (?i) to make the search case-insensitive.
Filtering is always applied to the full log, so certain lines can be shown in compact mode without any text highlighted if the filter matches a part that isn’t displayed. The full details of the line can be viewed using the action in the log viewer context menu.
Note that the Filter button is used to toggle the text filter on and off.
Log Entry Details
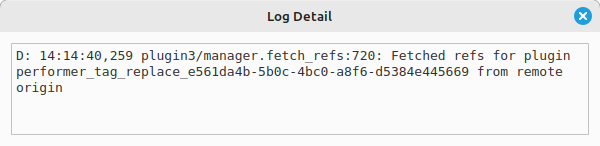
To view the details of a log entry, you can right-click on the entry in the log viewer, and select the action. This will open a dialog showing the full details of the log entry, including the log level, timestamp, module and method, and message.
Context Menu Options
The log viewer context menu provides additional options for managing the log entries. To access the context menu, right-click in the log viewer window.
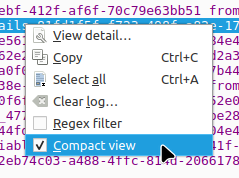
The context menu options include:
: View the details of the selected log entry. This action is only available when a single log entry is selected.
: Copy the selected log entry or entries as text to the clipboard. This action is only available when one or more log entries are selected.
: Select all log entries in the log viewer.
: Clear all log entries from the log. This will not affect the log level or debug options, so new log entries will continue to be logged at the selected level and with the selected debug options.
: Enable or disable the use of regular expressions for filtering log entries. When enabled, the text entered in the filter text box will be treated as a regular expression, and the log entries will be filtered based on whether they match the regular expression. When disabled, the text entered in the filter text box will be treated as a plain text string, and the log entries will be filtered based on whether they contain the specified text.
: Toggle compact view mode. When enabled, the log entries will be displayed in a more compact format, with less information displayed for each entry. The information removed from the displayed log entries in compact view includes the log level, and module and method. This can make it easier to view the log entries, but may make it more difficult to understand the context of each entry. The full display for an entry can be displayed using the action. When disabled, the log entries will be displayed in the standard format, with all information displayed for each entry.
Saving the Log
The log viewer provides the ability to export the log entries to a text file. To save the log, click the Save As… button at the bottom of the log viewer window. This will open a file dialog where you can specify the location and name of the log file to save. The exported log file will be in plain text format, and will include the log level, timestamp, module and method, and message for each log entry. This can be useful for sharing the log with others or attaching it to bug reports when troubleshooting issues with Picard.
Note that Save As… will export all log entries, regardless of the current filters applied in the log viewer. To only export a portion of the log, you can select the desired log entries in the log viewer, copy them to the clipboard using the action in the context menu, and then paste them into a text file or other document to share with others.
Caution
Even though Picard avoids logging passwords and such, the log file may contain sensitive information such as file paths, plugin names, and other details about your system and usage of Picard. You should review the log file and remove any sensitive information to ensure that you are comfortable with the information it contains before sharing it with others.